
Did you know that a well-run restaurant should maintain a net profit margin between 10-20%? However, many restaurant owners struggle to hit these numbers because they’re not tracking the right restaurant performance metrics.
While managing food costs between 28-35% is crucial, it’s just one piece of the puzzle. In fact, from customer satisfaction scores (targeting 85% or higher) to table turnover times (ideally 45-60 minutes during peak hours), restaurant KPIs touch every aspect of your operation. We’ve compiled 15 key metrics that successful restaurants are using to drive profit in 2025, complete with benchmarks and optimization strategies to help you exceed industry standards.
Revenue Per Available Seat Hour (RevPASH)

Image Source: Boston University
RevPASH stands as a cornerstone metric for measuring restaurant efficiency, introduced in 1998 by Cornell University’s School of Hotel Administration. This metric uniquely combines revenue, seating capacity, and time to provide a comprehensive view of restaurant performance.
Understanding RevPASH Calculation
The formula for RevPASH is straightforward: Total Revenue divided by Available Seat Hours, where Available Seat Hours equals the number of seats multiplied by operating hours. For instance, a restaurant generating INR 843,804 in monthly revenue with 100 seats operating 120 hours would have a RevPASH of INR 70.32.
RevPASH Impact on Profit
A high RevPASH indicates optimal utilization of dining spaces and successful revenue generation. Specifically, this metric helps identify peak performance hours and guides strategic decisions about staffing levels and resource allocation. Additionally, RevPASH provides insights into pricing strategies and menu optimization opportunities.
RevPASH Optimization Strategies
Successful restaurants focus on three primary areas to enhance their RevPASH. First, optimizing table configuration – converting a four-top table into two two-seaters can potentially double seating capacity during peak hours. Second, streamlining operations through pre-made bread baskets and automated kitchen tickets reduces table turnover time. Third, implementing demand-based pricing and creating specialized menus for peak hours can maximize revenue potential.
Furthermore, strategic pre-bussing and efficient front-of-house processes can significantly impact table turnover rates without compromising customer experience. Notably, during slower periods, introducing weekly specials or happy hour promotions can boost revenue when there’s typically a dip in profits.
Cost of Goods Sold (COGS)
Cost of Goods Sold (COGS) primarily determines a restaurant’s profitability by measuring the direct costs of producing menu items. As a crucial restaurant performance metric, COGS directly influences gross profit margins and operational decisions.
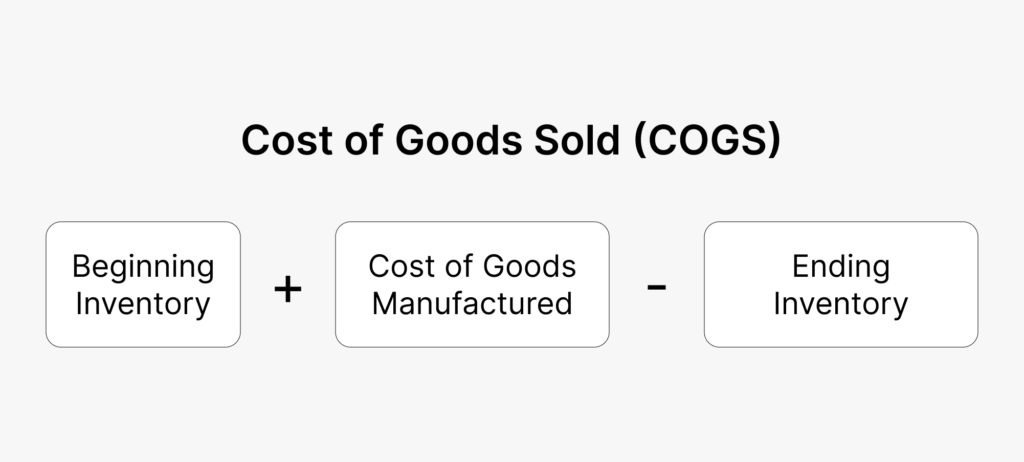
COGS Calculation Methods
The formula for calculating COGS follows a straightforward approach: Beginning Inventory + Purchased Inventory – Ending Inventory. For example, if your beginning inventory is INR 84,380, purchases total INR 337,521, and ending inventory is INR 42,190, your COGS would be INR 379,712. Moreover, to determine the COGS ratio, divide your total food and beverage costs by total revenue.
COGS Benchmarks for 2025
Industry standards suggest maintaining COGS between these key benchmarks:
| Category | Target Range |
|---|---|
| Overall COGS | 30-35% |
| Food Cost | 28-35% |
| Prime Cost Split | One-third of revenue |
COGS Reduction Strategies
Essentially, lowering COGS requires a multi-faceted approach. First, implement precise inventory tracking to prevent over-purchasing and minimize waste. Consequently, bulk purchasing of non-perishables can secure better pricing from suppliers.
To optimize costs further, focus on seasonal ingredients, which not only reduces expenses but also enhances menu appeal. Another effective strategy involves menu engineering – analyzing and adjusting menu items based on cost, popularity, and pricing.
Regular supplier comparisons and negotiations can yield substantial savings. Through automated inventory management systems, restaurants can track real-time costs and make data-driven decisions about purchasing and menu pricing.
Labor Cost Percentage
Labor costs represent a substantial portion of restaurant operating expenses, making them a critical performance metric for financial success. Primarily, these costs encompass wages, benefits, payroll taxes, and employee-related expenses.
Labor Cost Calculation
The standard formula for determining labor cost percentage follows a straightforward approach: (Total Labor Costs / Total Sales) x 100. For instance, if monthly labor expenses total INR 421,902 with sales of INR 1,265,706, the labor cost percentage equals 33.33%. Subsequently, this calculation helps identify potential areas for cost optimization and efficiency improvements.
Optimal Labor Cost Targets
Labor cost benchmarks vary by restaurant type:
| Restaurant Category | Target Range |
|---|---|
| Fast-food | 25% |
| Table Service | 30-40% |
| Fine Dining | 30-40%+ |
Generally, most restaurants aim to maintain labor costs between 20-35% of total revenue. Nevertheless, fine dining establishments often experience higher percentages due to specialized staff requirements and enhanced service levels.
Labor Cost Management Tips
Accordingly, successful restaurants implement several strategies to optimize labor expenses:
- Cross-train staff to increase versatility and reduce dependency on specific employees
- Schedule based on sales forecasts and peak periods to prevent overstaffing
- Monitor daily labor reports to identify trends and optimization opportunities
Through proper employee scheduling and training, restaurants can maintain service quality while keeping labor costs within target ranges. Therefore, implementing scheduling software and automated systems helps streamline operations and reduce unnecessary labor expenses.
Table Turnover Rate
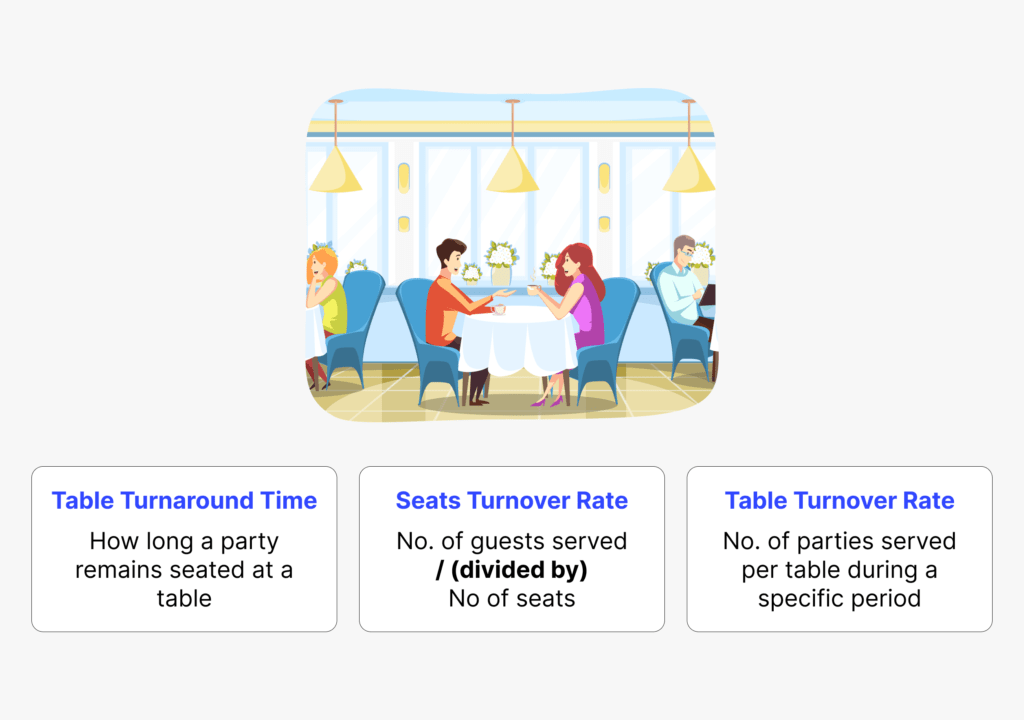
Tracking table turnover rate helps restaurants maximize seating capacity and boost revenue potential. This metric measures how many times a restaurant can seat different parties at the same table during a specific time period.
Measuring Table Turnover
The calculation follows a straightforward formula: Number of parties served divided by number of tables occupied. For instance, with 20 parties served across 5 tables during a 4-hour period, the turnover rate equals 4 turns. Throughout service periods, tracking this metric enables restaurants to identify peak performance times and optimize seating strategies.
Turnover Rate Standards
Industry benchmarks vary by restaurant category:
| Restaurant Type | Average Turn Time |
|---|---|
| Family Restaurant | 90 minutes |
| Fine Dining | 120 minutes |
| Casual Dining | 75 minutes |
Indeed, US diners demonstrate limited patience, with 36% willing to wait only 15 minutes for a table. Rather than risk losing customers, successful restaurants prioritize efficient table management.
Improving Table Efficiency
Primarily, restaurants can enhance turnover rates through strategic operational changes. Digital payment solutions reduce checkout times, simultaneously improving customer satisfaction and table availability. Particularly effective strategies include:
- Training servers to greet tables within one minute of seating
- Implementing mobile POS systems for faster order processing
- Setting clear time limits for peak dining periods
Modern point-of-sale systems track real-time table status, enabling managers to make data-driven decisions about seating arrangements and staff deployment. Through proper implementation of these strategies, restaurants can achieve optimal table turnover without compromising service quality.
Customer Acquisition Cost (CAC)

Understanding and managing customer acquisition cost (CAC) enables restaurants to evaluate their marketing effectiveness and optimize spending. Primarily, this metric reveals how much a restaurant spends to attract each new customer.
CAC Calculation Methods
The basic formula for calculating restaurant CAC follows a straightforward approach: Total Marketing Expenses divided by Total New Customers. Throughout the calculation process, restaurants must include all marketing-related costs, such as social media campaigns, advertising expenses, and promotional discounts. For instance, if a restaurant spends INR 84,380 on promotions in a month and brings in 100 first-time customers, the CAC equals INR 843.80.
CAC Benchmarks
Restaurant CAC benchmarks vary significantly by establishment type:
| Restaurant Category | Average CAC (INR) |
|---|---|
| Fast Food | 2,278 |
| Fast Casual | 7,003 – 10,547 |
| Fine Dining | 15,188 |
As a result of different menu prices and service levels, fine dining establishments often justify higher acquisition costs since customers tend to spend more per visit.
Reducing Acquisition Costs
First, analyze marketing channel performance to identify the most cost-effective options:
- DoorDash Marketplace Orders: Average cost per order INR 632.85
- Facebook Ads: Average cost per action INR 1,089.35
- Instagram Ads: Average cost per action INR 1,659.76
Second, implement A/B testing for social media campaigns and landing pages to optimize conversion rates. Third, focus on organic growth through customer loyalty programs, as retaining existing customers costs five times less than acquiring new ones.
Ultimately, successful restaurants maintain their CAC at 5-10% of their average first-year revenue from a customer. Through proper tracking and optimization of marketing channels, restaurants can significantly reduce their acquisition costs while maintaining a steady flow of new customers.
Average Check Size

Image Source: Allef Vinicius on Unsplash
Average check size directly impacts restaurant revenue, serving as a key indicator of sales effectiveness and customer spending patterns. Primarily, this metric reveals how well a restaurant maximizes revenue from each dining experience.
Check Size Analysis
The formula remains straightforward: Total Sales divided by Number of Transactions. Through careful analysis, restaurants can segment data based on dining occasions, meal times, and customer demographics to identify spending patterns. Typically, analyzing menu item contribution helps determine which dishes drive higher check averages and contribute most to overall revenue.
Upselling Techniques
Successful restaurants implement strategic upselling approaches:
| Technique | Impact |
|---|---|
| Staff Menu Knowledge | Builds customer confidence |
| Specific Suggestions | More effective than general asks |
| Timing-based Offers | Increases acceptance rate |
Staff training proves crucial, with servers needing comprehensive menu knowledge to suggest items confidently. Hence, restaurants that train staff to recommend specific bottles of wine or cocktails see better results than those making general beverage suggestions.
Check Size Optimization
Menu engineering markedly influences customer spending patterns. Evidently, positioning high-margin items in the menu’s top right corner, where customers typically begin reading, increases their visibility. Digital ordering platforms offer unique opportunities, automatically suggesting complementary items based on customer selections.
Seasonal promotions and limited-time offers create urgency and encourage higher spending. Ultimately, successful restaurants implement loyalty programs that reward higher spending, with data showing that mobile app users order 85% more frequently. Through consistent staff training and strategic menu design, restaurants can maintain steady growth in average check sizes while ensuring customer satisfaction.
Prime Cost Ratio
Prime cost ratio emerges as a fundamental restaurant performance metric, combining both food and labor expenses into a single powerful indicator. Primarily, this metric represents the sum of Cost of Goods Sold (COGS) and total labor costs.
Understanding Prime Costs
The calculation follows a precise formula: COGS plus Total Labor Costs divided by Total Sales. For illustration, with COGS at INR 506,282.70 and labor at INR 590,663.16, against total sales of INR 1,856,369.92, the prime cost ratio would be 59.1%.
Prime Cost Targets
Industry benchmarks vary by establishment type:
| Restaurant Category | Target Ratio |
|---|---|
| Quick Service | 55-60% |
| Full Service | 60-65% |
| Fine Dining | Up to 65% |
Above all, successful restaurants aim to maintain their prime cost ratio at 60% or lower, with an ideal split of 30% for COGS and 30% for labor.
Cost Control Strategies
Coupled with regular monitoring, effective prime cost management requires strategic implementation. At this point, successful restaurants focus on inventory management software to track product usage and maintain optimal stock levels. Analogous to this, building strong vendor relationships leads to better pricing terms, ultimately affecting the bottom line.
Regular recipe costing and plate cost calculations prevent unfavorable profit margins from increased food costs. Through consistent prime cost monitoring and strategic adjustments, restaurants can maintain healthy profit margins while ensuring quality service delivery.
Online Order Conversion Rate

Online ordering conversion rates have become a decisive performance metric for restaurants, with the food and beverage industry achieving the highest conversion rates at 3.7%. Throughout the digital transformation of restaurants, this metric has proven crucial for measuring online sales effectiveness.
Measuring Online Conversions
The calculation remains straightforward: divide completed orders by total website visitors. Desktop users demonstrate higher conversion rates at 1.7 times that of mobile users. First, direct traffic through bookmarks and direct URL entry yields the highest conversion rate at 3.5%. Second, Google Ads achieve 2.81% for search ads and 0.59% for display ads.
Digital Order Optimization
Successful restaurants focus on these key elements for maximizing conversions:
| Element | Impact Factor |
|---|---|
| Website Design | Fast-loading pages, mobile responsiveness |
| User Experience | Intuitive layout, clear instructions |
| Payment Options | Multiple digital payment methods |
Primarily, streamlining the checkout process has proven most effective in increasing conversions. Throughout the ordering journey, customers expect features like favorites buttons and reorder options.
Platform Performance
Platform-specific insights reveal that customers ordering directly from restaurants spend 35% more per transaction compared to third-party apps. Certainly, restaurants implementing integrated online ordering systems report 30% higher takeout profits. Mobile app users altogether demonstrate 85% higher order frequency.
Digital ordering platforms must support various payment methods, including credit cards, mobile wallets, and digital payment platforms. Ultimately, successful restaurants maintain detailed order tracking features and automated notifications to enhance customer experience and boost conversion rates.
Employee Turnover Rate

Image Source: Notch Financial
Employee turnover stands among the most expensive challenges facing restaurants, with the industry experiencing turnover rates substantially higher than other private sectors. Primarily, this metric affects both operational efficiency and customer satisfaction.
Turnover Cost Impact
The financial implications of employee turnover are substantial. Restaurants lose an average of INR 12,657,067.62 annually due to staff turnover. Typically, replacing a single front-line employee costs approximately INR 494,806.96. These costs break down into several categories:
| Cost Component | Amount (INR) |
|---|---|
| Productivity Loss | 257,299.62 |
| Pre-departure Tasks | 14,844.21 |
| Recruitment | 98,961.39 |
| Selection Process | 54,428.77 |
| Orientation/Training | 69,272.97 |
Industry Benchmarks
Presently, the restaurant industry faces challenging turnover statistics. The annual turnover rate reached 75% in early 2019, with fast-food establishments experiencing higher rates than fine dining venues. Full-service restaurants show turnover rates of 106%, while limited-service locations report 144%.
Retention Strategies
Successful restaurants implement multiple approaches to reduce turnover:
- Conducting exit interviews to identify underlying issues
- Providing career growth opportunities through mentorship programs
- Implementing recognition programs to boost employee morale
Consistently maintaining open communication about scheduling and involving staff in decision-making processes has proven effective in reducing turnover rates. Through proper implementation of these strategies, restaurants can significantly lower replacement costs while maintaining service quality.
Food Waste Percentage

Image Source: ResearchGate
Food waste measurement emerges as a vital restaurant performance metric, with American restaurants contributing to 13 million tons of annual food waste. Throughout the food service industry, 4-10% of food never reaches customer plates.
Waste Tracking Methods
Successful restaurants implement comprehensive tracking systems. A waste audit involves collecting and sorting daily trash, recording contents, quantities, and disposal reasons. Primarily, two key tracking components include:
| Tracking Component | Purpose |
|---|---|
| Food Log System | Monitors type and quantity of waste |
| Traffic Log System | Records customer flow and weather impact |
Waste Reduction Strategies
Standardized date labeling stands out as an effective strategy, considering that 90% of consumers discard food based on expiration dates. Spoilage prevention packaging for fresh produce, meat, and seafood extends shelf life. Throughout daily operations, waste tracking analytics help optimize food purchasing and preparation.
Cost Impact Analysis
The financial implications of food waste are substantial. Restaurants investing in food waste reduction programs experience up to 14-fold return on investment. Ultimately, reducing food waste by 50% could decrease total environmental impacts by 8-10%. Through proper waste management, restaurants minimize both operational costs and environmental impact, as food waste contributes significantly to greenhouse gas emissions and resource depletion.
Customer Satisfaction Score

Measuring customer satisfaction emerges as a vital indicator of restaurant success, with the Customer Satisfaction Score (CSAT) providing quantifiable insights into guest experiences. Primarily, this metric helps pinpoint areas of delight and concern in the dining journey.
CSAT Measurement
The measurement process involves asking customers to rate their satisfaction on a scale of 1 to 5. Throughout the evaluation, restaurants utilize various tools like Google Forms or SurveyMonkey for efficient data collection. First, direct questions about meal satisfaction yield higher completion rates, whereas lengthy surveys often discourage participation.
CSAT Benchmarks
Industry standards reveal compelling targets for restaurants:
| Category | Benchmark |
|---|---|
| Full-Service Restaurants | 81% |
| Fast Food Establishments | 78% |
| Overall Industry Target | 85% |
Improvement Strategies
Successful restaurants focus on multiple aspects to enhance satisfaction scores. A moderate increase in customer experience generates an average revenue increase of INR 69,445.11 million over three years for companies with INR 84.38 billion in annual revenues.
Namely, key improvement areas include:
- Offering complimentary extras, which 69% of diners say increases loyalty
- Remembering customer preferences, with 65% valuing their seating choices
- Maintaining cleanliness, as 75% of consumers avoid restaurants with negative cleanliness reviews
Unless restaurants consistently monitor and act on CSAT data, they risk losing customers, with 51% of guests never returning after one negative experience. Whether through mobile apps or traditional surveys, maintaining a response rate between 20-30% ensures accurate sentiment measurement.
Marketing ROI

Measuring return on investment for restaurant marketing initiatives provides crucial insights into campaign effectiveness. Primarily, established restaurants allocate between 3-6% of total sales revenue to marketing activities.
Marketing Cost Analysis
Throughout the industry, successful restaurants follow a 70/10/20 budget model:
- 70% towards proven marketing techniques
- 10% testing new approaches
- 20% scaling successful test campaigns
Campaign Performance Metrics
Print advertisements yield 112% ROI when executed properly. Email marketing generates INR 3,037.70 profit for every INR 84.38 spent, outperforming social media’s INR 236.27 return. Remarkably, 63% of consumers click on Google Ads, leading restaurants to invest seven times more in pay-per-click advertising than SEO.
ROI Optimization
The basic ROI formula follows: (Net Profit from Marketing – Marketing Cost) / Marketing Cost × 100%. Successful restaurants track these key performance indicators:
| Marketing Channel | Average Return |
|---|---|
| Email Campaigns | 3600% ROI |
| Social Media | 280% ROI |
| Print Media | 112% ROI |
Ultimately, video content shows exceptional potential, with 80% of consumers actively engaging with restaurant-related videos on social media. Through consistent monitoring and optimization of marketing channels, restaurants maintain healthy returns while expanding their customer base.
Inventory Turnover Ratio

Image Source: MarketMan
Efficient inventory management directly affects a restaurant’s bottom line, with operators who conduct weekly inventory counts adding between 2-10% to their profits. Throughout the restaurant industry, inventory turnover ratio serves as a crucial performance metric for tracking stock efficiency.
Inventory Management
Primarily, restaurants need systematic tracking methods to maintain optimal stock levels. Digital inventory management tools reduce inventory mistakes and overstock by up to 17%. Effectively implementing perpetual inventory tracking through POS systems, coupled with regular physical counts, provides the most accurate stock management approach.
Turnover Targets
The ideal inventory turnover ratio varies by restaurant type:
| Restaurant Category | Monthly Turnover Target |
|---|---|
| Quick Service | 4-6 times |
| Full Service | 4-8 times |
| Fine Dining | 3-5 times |
A higher turnover ratio indicates rapid selling and efficient inventory utilization. Consistently maintaining turnover between 4-8 times monthly ensures optimal stock control while minimizing holding costs.
Stock Optimization
Strategic procurement practices, including just-in-time ordering and strong supplier relationships, positively impact inventory turnover. First-In-First-Out (FIFO) inventory management prevents wastage from expired ingredients. Ultimately, successful restaurants leverage sophisticated inventory management systems for real-time tracking, facilitating timely restocking and reducing stockout risks.
Net Profit Margin
Net profit margin stands as the ultimate indicator of restaurant financial health, revealing how much revenue remains after accounting for all expenses. Primarily, this metric determines a restaurant’s long-term sustainability and growth potential.
Profit Margin Calculation
The formula follows a comprehensive approach: Net Profit Margin = [(Revenue – All Costs)/Revenue]*100. Throughout operations, this calculation encompasses every business expense, from food costs to utilities and technology. For instance, a restaurant generating INR 84.38 million in revenue with INR 75.94 million in total expenses achieves a 10% net profit margin.
Industry Standards
Restaurant categories demonstrate distinct profit margin ranges:
| Restaurant Type | Average Margin |
|---|---|
| Full Service | 3-5% |
| Quick Service | 6-9% |
| Pizzerias | 15% |
| Fine Dining | 5-10% |
Margin Improvement Tips
Effectively managing food costs through yield management and portion control directly impacts profit margins. Throughout daily operations, implementing menu engineering helps identify and promote high-profit items. Consistently focusing on customer retention proves valuable, as maintaining just 5% of existing customers can boost profit margins by 25%.
Automated inventory management systems enable real-time cost tracking, facilitating data-driven decisions about purchasing and pricing. Regular supplier comparisons and negotiations consistently yield substantial savings, ultimately contributing to healthier profit margins.
Digital Presence Score

Image Source: Market.us
A restaurant’s digital presence score has emerged as a defining factor in attracting and retaining customers, with 91% of consumers regularly reading online reviews before choosing where to dine. Initially, this metric encompasses multiple digital touchpoints that shape customer perception and drive business growth.
Online Rating Management
Maintaining a positive online reputation requires active management, as 84% of customers trust online reviews as much as personal recommendations. Typically, successful restaurants respond to reviews within 24 hours, with data showing that 33% of diners consider online reviews very important in their decision-making process.
Social Media Metrics
Key performance indicators for social media success include:
| Metric Type | Target Benchmark |
|---|---|
| Engagement Rate | 3.7% industry average |
| Desktop Conversion | 1.7x mobile rates |
| Direct Traffic | 3.5% conversion |
Digital Brand Growth
Primarily, restaurants focusing on digital brand expansion achieve higher visibility through strategic content creation. Alternatively, partnering with food bloggers or influencers increases reach, with influencer marketing influencing 75% of user purchase decisions. Through consistent digital presence management, restaurants maintaining a 4+ star rating attract 33% more customers.
User-generated content proves 85% more effective than traditional posts, while email marketing campaigns yield INR 3,037.70 for every INR 84.38 invested. Ultimately, successful restaurants leverage these metrics to optimize their digital strategy and enhance customer engagement across all platforms.
Conclusion
Restaurant success demands careful attention to multiple performance metrics across different operational areas. These 15 critical metrics provide a comprehensive framework for maximizing profitability and growth in 2025.
Financial metrics like COGS and prime cost ratio help restaurants maintain healthy margins between 10-20%. Our analysis shows successful establishments keep their COGS between 28-35% while managing labor costs at 30-40% of revenue.
Operational efficiency metrics reveal opportunities for revenue optimization. RevPASH calculations guide strategic decisions about seating arrangements and pricing, while table turnover rates averaging 45-60 minutes during peak hours maximize capacity utilization.
Customer satisfaction scores tell a clear story – restaurants maintaining 85%+ satisfaction ratings see significant revenue growth. Digital presence scores demonstrate equal importance, with 91% of customers reading online reviews before choosing where to dine.
Marketing performance metrics complete this picture. Email campaigns generate INR 3,037.70 for every INR 84.38 spent, while proper inventory management adds 2-10% to bottom-line profits.
These metrics work together as essential tools for restaurant success. Regular monitoring and optimization of each metric enables data-driven decisions that boost profitability while enhancing customer experience. Start implementing these metrics today to position your restaurant for sustainable growth in 2025 and beyond.
FAQs
Q1. What is RevPASH and why is it important for restaurants?
RevPASH (Revenue Per Available Seat Hour) is a key metric that measures restaurant efficiency by combining revenue, seating capacity, and time. It’s important because it helps identify peak performance hours, guides staffing decisions, and provides insights into pricing strategies and menu optimization opportunities.
Q2. How can restaurants reduce their Cost of Goods Sold (COGS)?
Restaurants can reduce COGS by implementing precise inventory tracking, bulk purchasing non-perishables, focusing on seasonal ingredients, and using menu engineering. Regular supplier comparisons and negotiations, along with automated inventory management systems, can also yield substantial savings.
Q3. What is a good table turnover rate for restaurants? A good table turnover rate varies by restaurant type. Family restaurants aim for about 90 minutes, fine dining establishments for 120 minutes, and casual dining restaurants for 75 minutes. Implementing strategies like digital payment solutions and efficient order processing can help improve turnover rates without compromising service quality.
Q4. How can restaurants improve their online order conversion rates?
To improve online order conversion rates, restaurants should focus on optimizing website design for fast loading and mobile responsiveness, streamlining the checkout process, offering multiple digital payment options, and implementing features like favorites buttons and reorder options. Integrated online ordering systems have shown to increase takeout profits by 30%.
Q5. What is the ideal net profit margin for restaurants?
The ideal net profit margin varies by restaurant type. Full-service restaurants typically aim for 3-5%, quick-service restaurants for 6-9%, pizzerias for around 15%, and fine dining establishments for 5-10%. Successful restaurants focus on managing food costs, implementing menu engineering, and retaining customers to improve their profit margins.
Your point of view caught my eye and was very interesting. Thanks. I have a question for you.
I don’t think the title of your article matches the content lol. Just kidding, mainly because I had some doubts after reading the article. https://accounts.binance.info/hu/register-person?ref=IQY5TET4
Your article helped me a lot, is there any more related content? Thanks! https://www.binance.info/bn/register-person?ref=WTOZ531Y
Thanks for sharing. I read many of your blog posts, cool, your blog is very good. https://accounts.binance.com/ph/register?ref=IU36GZC4
Thank you for your sharing. I am worried that I lack creative ideas. It is your article that makes me full of hope. Thank you. But, I have a question, can you help me?
Thanks for sharing. I read many of your blog posts, cool, your blog is very good.
Your article helped me a lot, is there any more related content? Thanks! https://www.binance.com/register?ref=IHJUI7TF